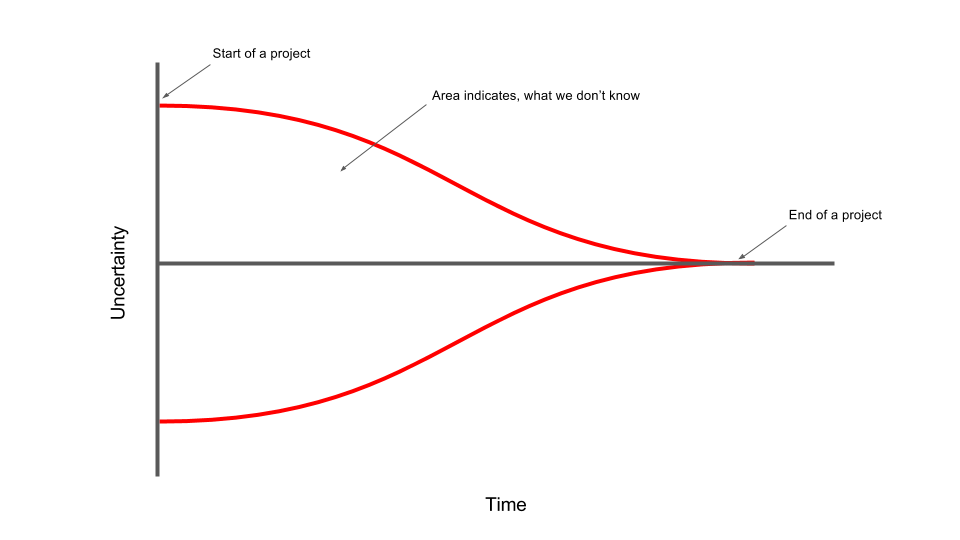
The cone of uncertainty is a great diagram to explain the level of confidence that a software development team typically has at various stages of a project. What I like the most about the diagram is that it clearly depicts that at the start of the project, a lot is unknown. The initial learning's and analysis at the start of the project assists greatly in reducing that uncertainty but it never removes all uncertainty (it never reaches zero). Even after the initial drop of uncertainty during the early analysis phase the graph is still far from zero.
The cone of uncertainty is a good tool to help explain that perfect planning is a fallacy, an unachievable goal - simply because there is too much uncertainty at the start of a project. The only way to remove that uncertainty is to continue forward and learn more.
What teams often forget and fail to acknowledge is that once the planning or early analysis phase has concluded, there is still a large amount of uncertainty that still needs to be managed.
Presenting this diagram at the start of the project can be helpful to set expectations about how confident stakeholders and the team should be with estimates around dates, scope and budget. It can also be helpful to periodically revisit the diagram to see how the team is trending. If the project is progressing along the x-axis and certainty is not reducing, this can be an early indicator that something is going wrong and there are some issues to be addressed, addressing these issues can be done through a Five Why activity.
